| Propagation |
This page contains a dynamic collection of propagation information gathered from many different sources. This data is extremely useful for ham radio operators and shortwave listeners to help determine whether or not long distance radio communications are possible.
The current time is: 13:45 UTC on Wednesday, July 29, 2026
| Current Solar Indices from WWV |
|
29-Jul-2026 at 1210 UTC
SFI = 143 A = 8 K = 1 |
| Conditions during the last 24 hours |
|
No space weather storms were observed for the past 24 hours.
|
| Forecast for the next 24 hours |
|
No space weather storms are predicted for the next 24 hours.
|
![]()
Solar Wind Data
Provides solar wind velocity and energetic particle intensity
Updated at: 1337Z on July 29, 2026
| Velocity (km/s): | 336.2 |
| Density (protons/cm3): | 0.8 |
(ACE satellite solar wind data has been intermittent)
![]()
| The Penticton Observatory SFI value on 28-Jul-2026 at 2300Z was: | 143 |
![]()
| Date | SFI | A-index |
| 29 Jul | 145 | 8 |
| 30 Jul | 145 | 12 |
| 31 Jul | 140 | 15 |
| Solar Activity Forecast |
| Solar activity is expected to be low with a chance for M-class flares (R1-R2, Minor-Moderate) through 30 Jul. |
| Geophysical Activity Forecast |
| The geomagnetic field is expected to be quiet to active (below G1-Minor) on 29 Jul as weak CME effects persist. Unsettled to active levels are likely again beginning late on 30 Jul with the arrival of the 26-27 Jul CMEs. |
![]()
| Date | Time | Magnitude | 27-Jul-2026 | 0243Z | M1.0 | 26-Jul-2026 | 1528Z | M3.2 |
![]()
| The NOAA Sunspot number for 28-Jul-2026 was: | 102 |
| Most recent five days (oldest first): | 88 101 86 99 89 |
![]()
| The GOES-14 Background X-ray Flux level on 28-Jul-2026 was: | * |
| Most recent five days (oldest first): | * * * * * |
![]()
![]()
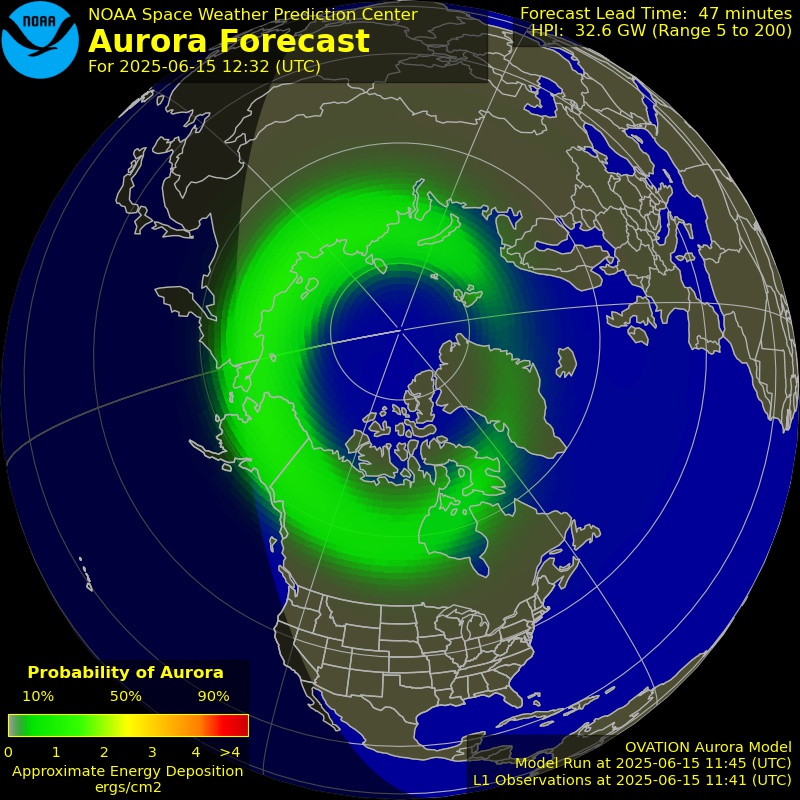
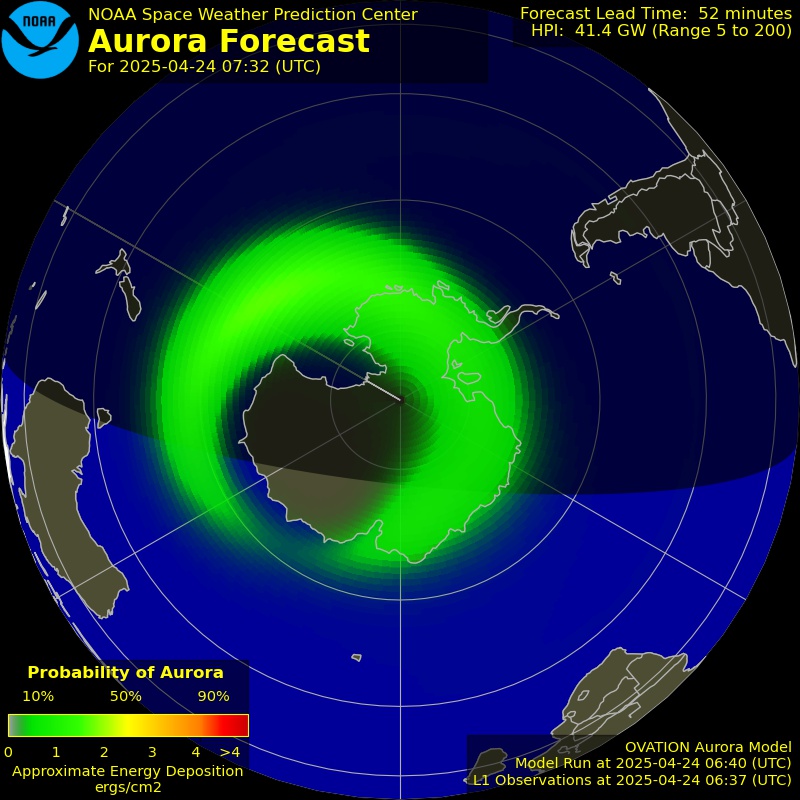
Auroral Activity
Aurora (also known as "aurora borealis" or "northern lights") is caused by interaction between the Earth's magnetic field and the solar wind (a mix of charged particles blowing away from the sun). During storms, enough of these charged particles make it through to the Earth's upper atmosphere that they interact with the earths natural magnetic field lines. When enough of these particles collide, energy is released in the form of auroral light. In addition to creating a pretty light show (mostly in upper latitudes), ham radio signals scatter off of these particles and can greatly enhance propagation on the VHF and UHF ham radio bands. High levels of aurora can also make HF ham radio propagation via polar routes difficult.
Real-Time
|
Real-Time
|
Click on thumbnails to view a
larger image
Images courtesy of the NOAA Auroral
Activity site
Solar X-ray Flux
This chart shows X-ray flux levels as measured by the GOES-13 and GOES-15 satellites. The measurements (shown in red) are used to issue alerts when X-ray flux levels exceed certain levels. Spikes on the chart correspond to solar flares. Flares are considered "significant" when flux levels rise above the "M" level (as shown on the right side of the chart). These large flares can often wipe out the ham radio and shortwave bands almost immediately and it can take minutes to hours for the bands to recover. If the ham radio bands seem to go dead all of a sudden, it is always a good idea to check this chart to see if a large flare has occurred recently.
The Solar X-ray Flux graph is temporarily broken.
Click here to view it on the NOAA site
Dynamically updating plots:
1-minute and 5-minute X-ray
K-index
D-Layer Absorption
Proton
Flux Electron Flux GOES Magnetometer
Grey Line Map
The grey line is a band around the Earth that separates the daylight from darkness. Radio propagation along the grey line is very efficient. One major reason for this is that the D layer, which absorbs HF signals, disappears rapidly on the sunset side of the grey line, and it has not yet built upon the sunrise side. Ham radio operators and shortwave listeners can optimize long distance communications to various areas of the world by monitoring this area as it moves around the globe. This map shows the current position of the grey line terminator.

Click here to show a dynamically updating Grey Line map
MUF map
The following map shows Maximum Usable Frequencies (MUFs) for 3000 kilometer radio signal paths. The grey line position is also provided.

Image courtesy of the KC2G propaation pages
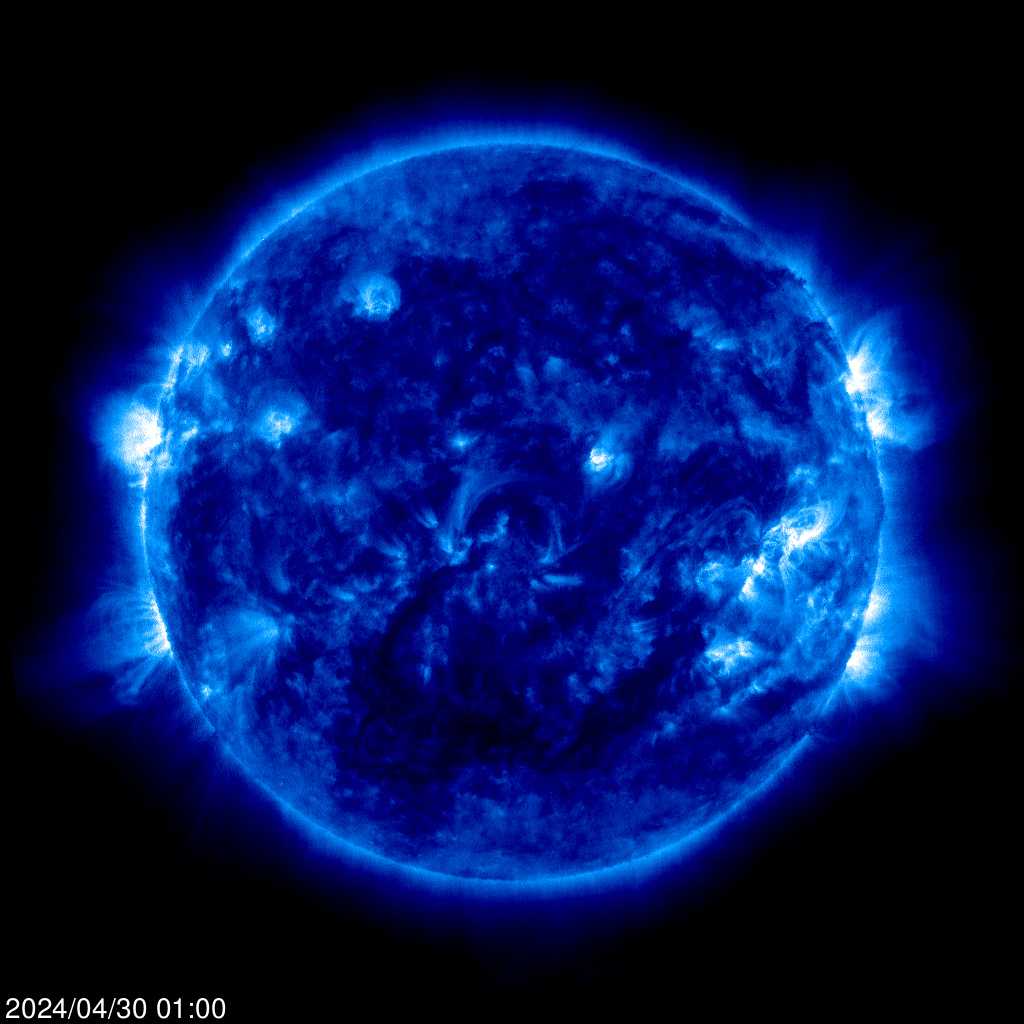
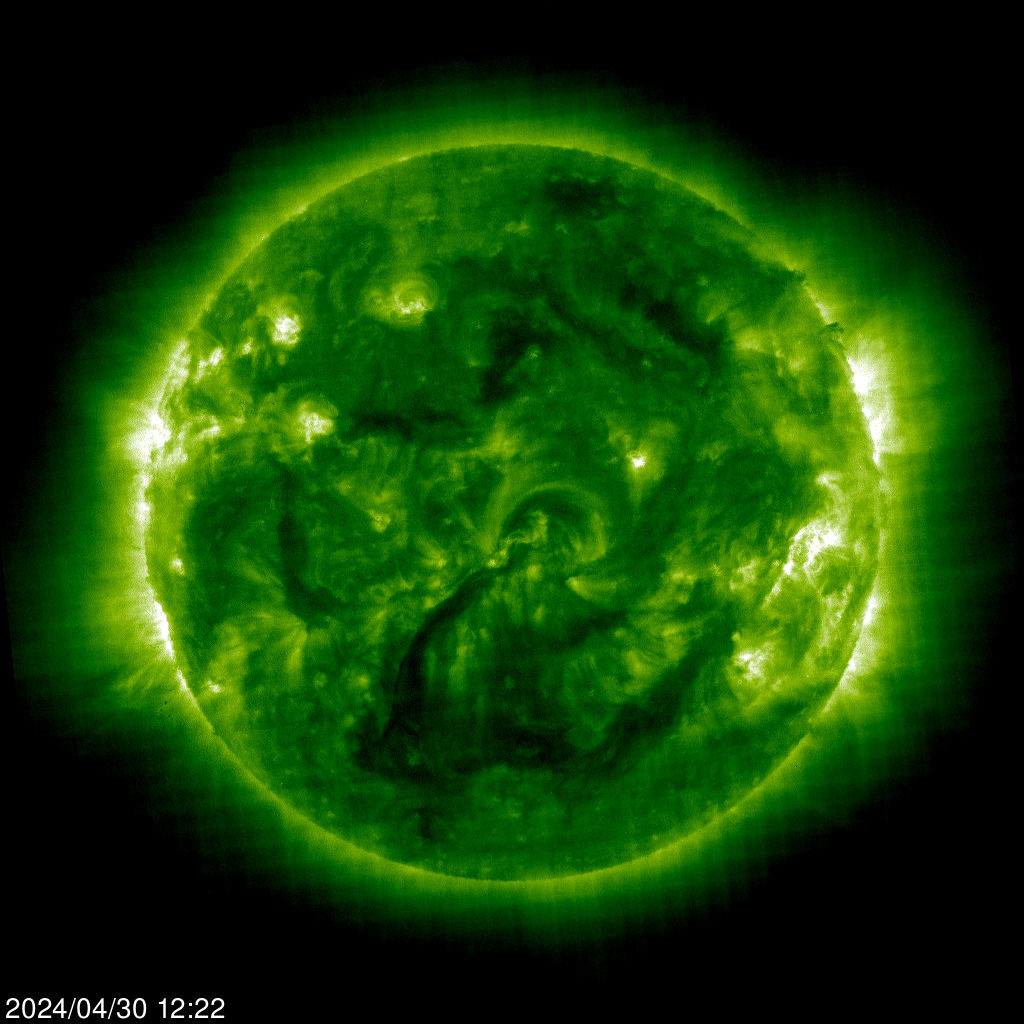
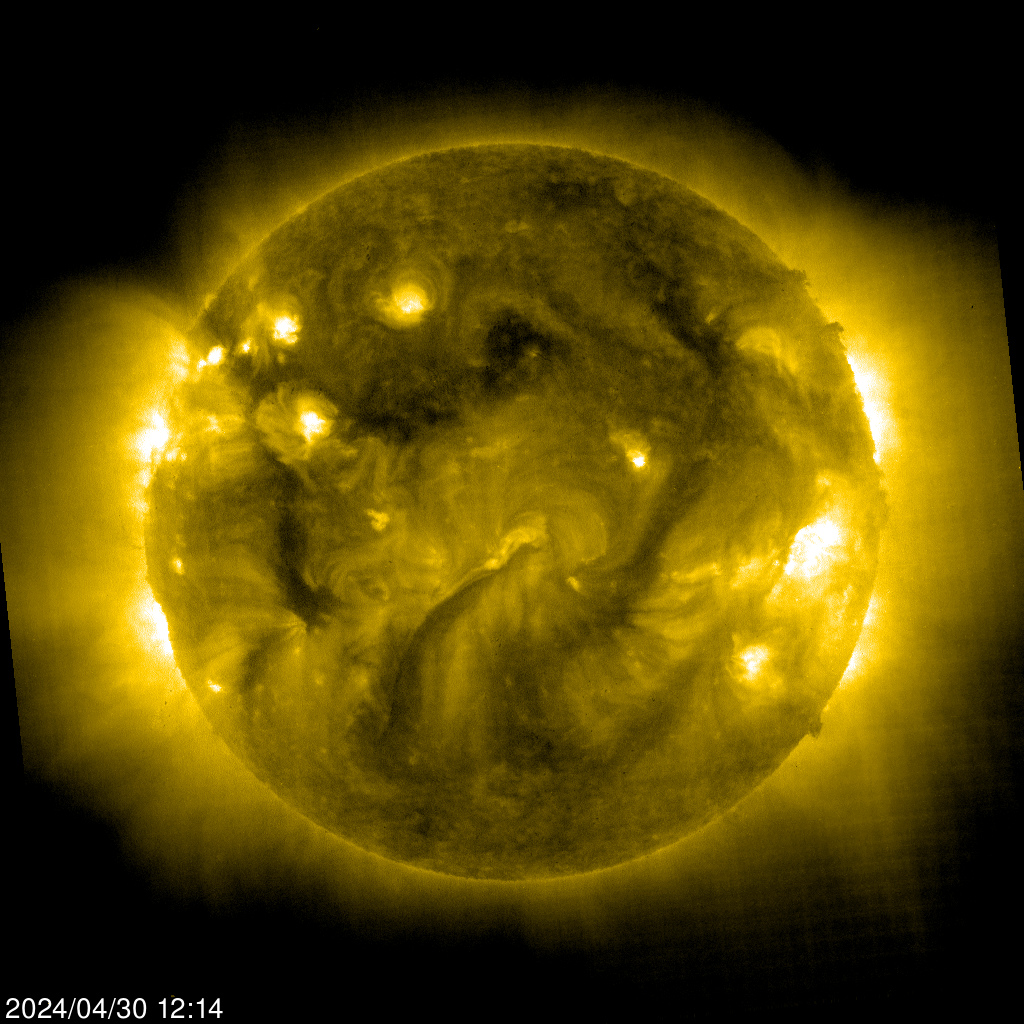
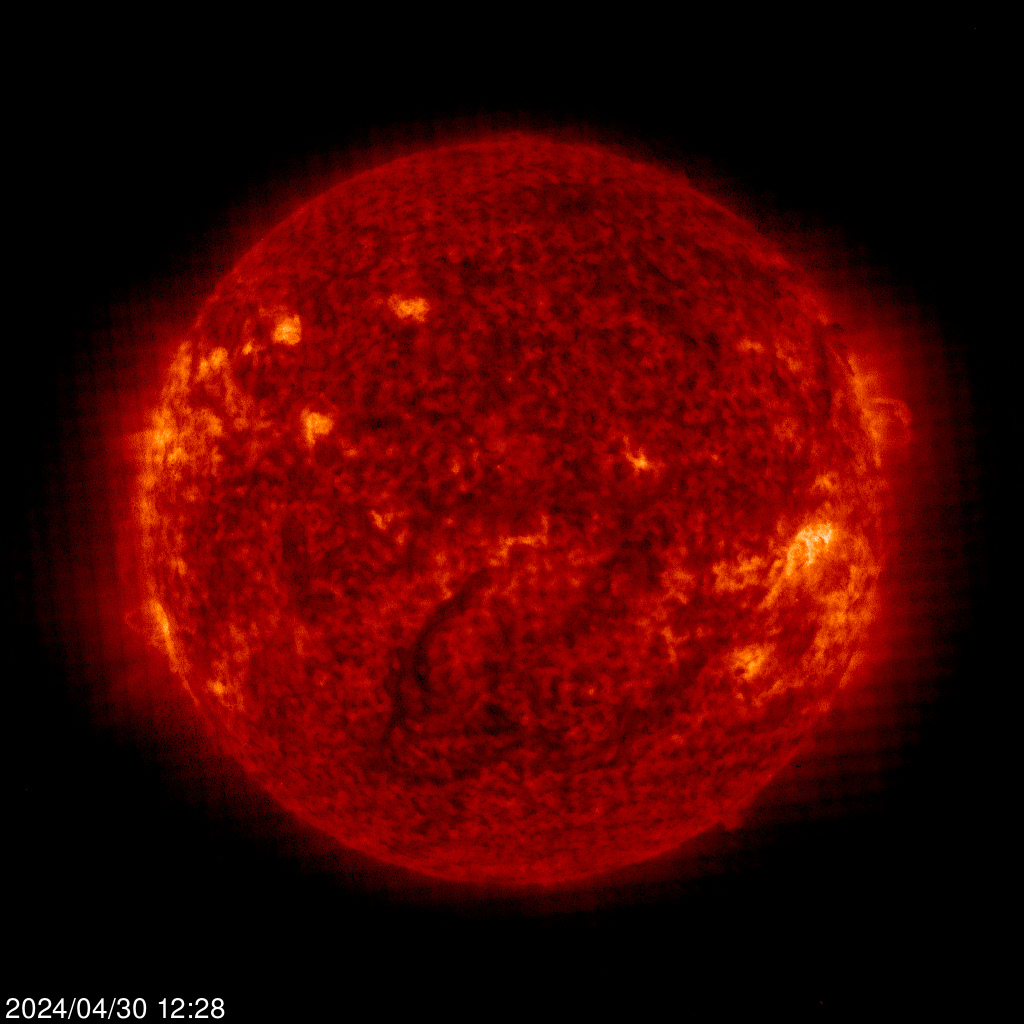
Current Sun Images
The images below are current views of the sun shown at different wavelengths of light as taken by SOHO and the Yohkoh soft-Xray telescope. Generally, more bright regions on the disk indicates more solar activity, which usually leads to higher flux levels (which also often leads to better ham radio and shortwave propagation). Click on any thumbnail to view a larger image.
SOHO - 17.1nm
|
SOHO - 19.5nm
|
SOHO - 28.4nm
|
SOHO - 30.4nm
|
Sometimes you may see the text "CCD Bakeout" instead of the images. This occurs when NASA does routine maintenance and calibration on the cameras. For a more technical explanation, read NASA CCD Bakeout explanation.
Images courtesy of the SDAC at the NASA Goddard Space Flight Center
|
|
Help support dx.qsl.net! Make your Amazon purchases by clicking on the Amazon icon. |
Layout and dynamic reports created by amateur radio N6RT
Comments or Questions? Email [email protected]